Today we are announcing an upcoming change to Office that blocks activation of Flash, Shockwave and Silverlight controls within Office.
We are taking this step based on the following factors:
- Use of some these controls in exploit campaigns to target end users of Office.
- Low observed use of these controls within Office.
- Upcoming end of support for some these components
- On July 2017, Adobe announced that Flash will no longer be supported after 2020. Major browsers including Edge, Chrome, Safari and Firefox have announced their respective roadmaps for ending support for Flash.
- Silverlight is expected to reach end of support in 2021 with support for several browsers and OS platforms already ended in 2016.
Note: This change only applies to Office 365 subscription clients. It will not apply to Office 2016, Office 2013 or Office 2010.
Customers who wish to enforce this behavior now in Office 365 subscription clients or in Office 2016 perpetual and down level versions can use the guidance published here to block controls targeted by this change.
Furthermore, customers can also take advantage of the recently published Security Baseline for Office 2016 that includes a custom Group Policy that blocks Flash.
What does this update block?
This change blocks the activation of the following controls within the Office process.
|
Control
|
CLSID
|
|
Flash
|
D27CDB6E-AE6D-11CF-96B8-444553540000
D27CDB70-AE6D-11CF-96B8-444553540000
|
|
Shockwave
|
233C1507-6A77-46A4-9443-F871F945D258
|
|
Silverlight
|
DFEAF541-F3E1-4c24-ACAC-99C30715084A
|
Some examples of scenarios that would be impacted by this change are:
- Controls directly embedded in an Office document, for example, Flash video directly embedded within a PowerPoint document using the Insert Object functionality
- Controls invoked by extensibility components within the Office process, for example, Power View add-in that uses Silverlight
Note: this change does not cover scenarios where these controls are activated outside the Office process, for example, a Flash video inserted into a document via the Insert Online Video functionality.
When would this block take effect?
This change only applies to Office 365 subscription clients and is targeted to take effect in the following order
- Controls are blocked in Office 365 Monthly Channel starting in June 2018.
- Controls are blocked in Office 365 Semi Annual Targeted (SAT) Channel starting in September 2018.
- Controls are blocked in Office 365 Semi Annual (SA) Channel starting in January 2019.
Can I unblock these controls if I need to?
Yes. While we are confident that this will not impact most Office users, we do understand there is potential to impact some of our users and we apologize for the inconvenience caused as a result.
Please refer to support guidance published here if you need to unblock controls critical to your workflow.
In closing, we believe this is another step forward in elevating the security of Office. One that protects our users from malicious attacks without disrupting day to day productivity for most of them.
The following is provided from Microsoft Security and Compliance blogs at TechCommunity:
Today we are announcing an upcoming change to Office that blocks activation of Flash, Shockwave and Silverlight controls within Office.
We are taking this step based on the following factors:
- Use of some these controls in exploit campaigns to target end users of Office.
- Low observed use of these controls within Office.
- Upcoming end of support for some these components
- On July 2017, Adobe announced that Flash will no longer be supported after 2020. Major browsers including Edge, Chrome, Safari and Firefox have announced their respective roadmaps for ending support for Flash.
- Silverlight is expected to reach end of support in 2021 with support for several browsers and OS platforms already ended in 2016.
Note: This change only applies to Office 365 subscription clients. It will not apply to Office 2016, Office 2013 or Office 2010.
Customers who wish to enforce this behavior now in Office 365 subscription clients or in Office 2016 perpetual and down level versions can use the guidance published here to block controls targeted by this change.
Furthermore, customers can also take advantage of the recently published Security Baseline for Office 2016 that includes a custom Group Policy that blocks Flash.
What does this update block?
This change blocks the activation of the following controls within the Office process.
|
Control
|
CLSID
|
|
Flash
|
D27CDB6E-AE6D-11CF-96B8-444553540000
D27CDB70-AE6D-11CF-96B8-444553540000
|
|
Shockwave
|
233C1507-6A77-46A4-9443-F871F945D258
|
|
Silverlight
|
DFEAF541-F3E1-4c24-ACAC-99C30715084A
|
Some examples of scenarios that would be impacted by this change are:
- Controls directly embedded in an Office document, for example, Flash video directly embedded within a PowerPoint document using the Insert Object functionality
- Controls invoked by extensibility components within the Office process, for example, Power View add-in that uses Silverlight
Note: this change does not cover scenarios where these controls are activated outside the Office process, for example, a Flash video inserted into a document via the Insert Online Video functionality.
When would this block take effect?
This change only applies to Office 365 subscription clients and is targeted to take effect in the following order
- Controls are blocked in Office 365 Monthly Channel starting in June 2018.
- Controls are blocked in Office 365 Semi Annual Targeted (SAT) Channel starting in September 2018.
- Controls are blocked in Office 365 Semi Annual (SA) Channel starting in January 2019.
Can I unblock these controls if I need to?
Yes. While we are confident that this will not impact most Office users, we do understand there is potential to impact some of our users and we apologize for the inconvenience caused as a result.
Please refer to support guidance published here if you need to unblock controls critical to your workflow.
In closing, we believe this is another step forward in elevating the security of Office. One that protects our users from malicious attacks without disrupting day to day productivity for most of them.
The above was provided from Microsoft Security and Compliance blogs at TechCommunity
Today we are announcing an upcoming change to Office that blocks activation of Flash, Shockwave and Silverlight controls within Office.
We are taking this step based on the following factors:
- Use of some these controls in exploit campaigns to target end users of Office.
- Low observed use of these controls within Office.
- Upcoming end of support for some these components
- On July 2017, Adobe announced that Flash will no longer be supported after 2020. Major browsers including Edge, Chrome, Safari and Firefox have announced their respective roadmaps for ending support for Flash.
- Silverlight is expected to reach end of support in 2021 with support for several browsers and OS platforms already ended in 2016.
Note: This change only applies to Office 365 subscription clients. It will not apply to Office 2016, Office 2013 or Office 2010.
Customers who wish to enforce this behavior now in Office 365 subscription clients or in Office 2016 perpetual and down level versions can use the guidance published here to block controls targeted by this change.
Furthermore, customers can also take advantage of the recently published Security Baseline for Office 2016 that includes a custom Group Policy that blocks Flash.
What does this update block?
This change blocks the activation of the following controls within the Office process.
|
Control
|
CLSID
|
|
Flash
|
D27CDB6E-AE6D-11CF-96B8-444553540000
D27CDB70-AE6D-11CF-96B8-444553540000
|
|
Shockwave
|
233C1507-6A77-46A4-9443-F871F945D258
|
|
Silverlight
|
DFEAF541-F3E1-4c24-ACAC-99C30715084A
|
Some examples of scenarios that would be impacted by this change are:
- Controls directly embedded in an Office document, for example, Flash video directly embedded within a PowerPoint document using the Insert Object functionality
- Controls invoked by extensibility components within the Office process, for example, Power View add-in that uses Silverlight
Note: this change does not cover scenarios where these controls are activated outside the Office process, for example, a Flash video inserted into a document via the Insert Online Video functionality.
When would this block take effect?
This change only applies to Office 365 subscription clients and is targeted to take effect in the following order
- Controls are blocked in Office 365 Monthly Channel starting in June 2018.
- Controls are blocked in Office 365 Semi Annual Targeted (SAT) Channel starting in September 2018.
- Controls are blocked in Office 365 Semi Annual (SA) Channel starting in January 2019.
Can I unblock these controls if I need to?
Yes. While we are confident that this will not impact most Office users, we do understand there is potential to impact some of our users and we apologize for the inconvenience caused as a result.
Please refer to support guidance published here if you need to unblock controls critical to your workflow.
In closing, we believe this is another step forward in elevating the security of Office. One that protects our users from malicious attacks without disrupting day to day productivity for most of them.
Publishers note: I am posting this on behalf my colleague Jon Nordstrom who is part of the Office 365 customer experience team. Myself and few other engineers thought you would all benefit from his knowledge of the Office 365 management activity API
A common question we get from organizations that move to Office 365 is, how do I get visibility into transactions that effect the information stored in Office 365. The security and compliance center and the Office 365 Management Activity API provide organizations with this visibility though detailed information with regards to user, admin, system, and policy actions and events from Office 365 and Azure Active Directory (Azure AD).
Reviewing the wealth of information available via the API and the audit logs, can be challenging though. Triaging detection results manually and categorizing related activities into groups can be difficult. The amounts of data generated from likely malicious activity can overwhelm investigators with irrelevant results. We know from experience the importance of accurate tooling, Microsoft Online Services processes petabytes of event monitoring data.
When Microsoft Online Services engineering started on the journey to view detection results as graphs we found that it enabled us to:
- evaluate intrusion detection results in context with related activity
- incorporate lower-fidelity indicators without being overwhelmed with benign results
- determine with greater fidelity when datacenter activity is likely to represent an intrusion
In this first post of our two-part series we will to help you understand how you can get the data necessary to perform a security analysis of it. The second post will focus on examples scenarios and using Power BI to visualize the data.
We are going to use Azure Cosmos DB, Azure Function Apps and cloud message queues to retrieve and store information. The data stores can be removed or purged, and the solution can be disabled or removed. Azure Cosmos DB also allows for the concept of TTL to expire content if you continue to synchronize the information. The sample graphs generated in this post were created with the free version of the ZoomCharts add-in for Power BI Desktop. Depending on your need there are several other graph add-ins available such as Network Navigator Chart and Force-Directed Graph. If you already have a method for obtaining data from the Activity API such as Azure Log Analytics , then continue to use that and access the information from Power BI which we briefly discuss in this post and go into more detail in next post.
1. Register an App with Azure Active Directory
Use this as a guide to create and register an application for making calls to the Office 365 Activity API. There are more detailed information about app registrations here. For this environment, the “Configure an X.509 certificate to enable service-to-service calls” is not necessary; it is enough to have an application with the appropriate permissions set. Don’t forget to complete the Administrator consent.
2. Setting up the infrastructure to push the Office 365 activities
The first step is to push the information you need to a store. We’ll use this sample from GitHub https://github.com/OfficeDev/O365-ActivityFeed-AzureFunction that allow you to push the past seven days of Office 365 Activity data to an instance of Azure Cosmos DB. You can limit the number of days and the workloads as needed. The code is created to run in two Azure Functions (PowerShell is currently in preview).
- Azure Function 1 places activity messages in a cloud message queue.
- Azure Function 2 picks up messages from that queue and transmits them to Azure Cosmos DB.
1. Create Function 1. (QueueEvents.ps1)
Remember to register a new Application in Azure Active Directory with adequate permissions before you take these steps.
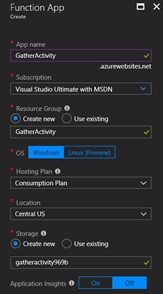
If you don’t already have a Function App start to create one. By default, runtime is limited to 5 minutes for the functions running under the consumption plans, however, you can increase the runtime up to 10 minutes. An alternative is to use the App Consumption plan if you expect longer execution times. The consumption plans typically cover the need for retrieving the event data.
Create a New Function in the Function App

Enable experimental Language support, select Timer trigger and PowerShell.

Name the new function, and select the schedule for the trigger, which determines how often the function will pull data. A workload.log file is used to keep track of time to prevent duplicate requests.

Next, paste the code for function 1., QueueEvents.ps1 to the function.
Adjust the variables for sign in based on the AAD application registered. The Tenant GUID can be found under the Endpoints in the app registration. It is listed as part of the endpoints.

We will come back to adjust the storage variables shortly as part of the integration of the storage queues. Optionally modify the included workloads or message size. Note that reducing message size will increase the number of times Azure Function 2 is run. Making message size too large (for example, > 100) may cause you to exceed the limits of the queue and reduce performance.

Next, select integrate and add an Azure Queue Storage output. The queue name is specified using the $storageQueue variable use ‘outQueue’with single quotes unless you changed the queue name in the output settings. Click, Show Value on the “Storage account connection” and copy the Account key value to $StorageAccountKey and the AccountName to $StorageAccountName. These steps are required to use cloud queue functionality. A regular storage queue call does not allow for multiple objects.

Do verify that the queue was created, there have been some instances in the testing where they weren’t. In that case create a queue manually in the associated storage account.

2. Create Function 2. (StoreEvents.ps1)
Follow these steps to create the second function, which is a Queue trigger. Create a new Function in the previously created Function App. Provide a Queue name and the storage account defined in Function 1.

Add the code StoreEvents.ps1 and the information for the auth variables. The $triggerInput variable is the message parameter name.

Select Integrate and add a Cosmos DB. The $outputdocument variable is based on the Document parameter name. If you change the name, you must also change the name of the variable. Click Show Value for “Azure Cosmos DB account connection” and store the account key for making requests from Power BI (an alternative is to navigate to the Cosmos DB and use a read-only key).
If you don’t already have an Azure Cosmos DB in place create a new database before creating the output. If you don’t have a Cosmos DB and collection, ensure to set the checkbox to create the Azure Cosmos DB and collection.

3. Start the functions.
If you haven’t enabled the Office 365 Activity API subscriptions that is the first step to take. There is a sample script for how to enable the subscriptions at the GitHub page it can be run from on-premises (Enablesubscription.ps1). Do enable Office 365 audit log search as well.
When configuring a start date for retrieving data, note that the maximum time span is the past 7 days based on Activity API restrictions.
If you change variable $StoredTime = Get-content $Tracker to a date in the format of “yyyy-MM-ddTHH:mm:ss.fffZ” the workloads will use it as the starting point (e.g., $StoredTime = “2018-04-12T01:34:18.702Z”). Either disable the function after it has completed a first run or replace it with Get-content $Tracker as the next scheduled run will process the same data if not adjusted.
Alternatively, you can use Azure Storage Explorer and add these files with your desired start time to the root of the Azure functions blob store:
- Audit.AzureActiveDirectory.log
- Audit.SharePoint.log
- Audit.Exchange.log
- Audit.General.log
- DLP.All.log
The only thing you need in the file is the date example “2018-03-27T11:34:18.702Z” without the quotation marks. The log files allow for continuous synch excluding content previously synchronized.

When the functions are started, invocation logs will indicate if there are any issues. Use Azure Storage Explorer to view the storage queues.
If the function for some reason breaks the workload.log files will not be updated, and the function will start from the date last stamped in the workload.log file. There may be some overlap, but the analysis tools will identify any duplicates.
Ensure that the data is reaching your Cosmos DB instance by navigating to the Database, as shown below.

3. Open the data in Power BI
Download the Power BI Desktop client and the ZoomCharts referenced previously. Select to connect to Azure Cosmos DB in the Power BI desktop client.

Specify your connection string, etc., and optionally specify a query to limit the scope to the asset you want to investigate. Do remember that everything is case sensitive. In this case I have scoped it down to a specific site. Please see the GitHub page for more query samples. The subsequent step will require the Cosmos DB storage key that you stored as part of setting up the Cosmos DB.

Expand the columns by selecting the expand arrows. When done close and apply.

Import the Zoomchart visual if you haven’t completed that step previously.

Load the Nodes you want to review and the Measure.

Change the Measure to count to make the node sizes reflect the actual number of occurrences as an example

In many cases you can export csv files or directly make relationships to existing data and join it with the activity data. This is an example where we imported a few admin accounts from adminlist.csv. It could just as well be a number of files or ip addresses for which you need more information. We loaded the csv file.

In the next step we went to Relationships and joined the Adminlist with the UserID field to allow us to eliminate all accounts but those we are investigating.

In the visual level filter, we removed any account but those we are investigating

Summary
We have provided you with a starting point for how to analyze Office 365 Data using Power BI. The data can be pivoted and analyzed in many ways. Templates and continuously pulling the Activity Data can be used to quickly load data and draw conclusions from the wealth of information. Other event sources such as on premises Intrusion Detection Systems, Information classification systems or Azure Information Protection may be used to join with the activity data to improve visibility.
Our next post will provide more examples of analyzing information using Graphs.
If you have any feedback please provide it at the GitHub project page or by emailing it to cxprad@microsoft.com.
We look forward to hearing from you!
—Jon Nordstrom, senior program manager, Office 365 customer experience
Publishers note: I am posting this on behalf my colleague Jon Nordstrom who is part of the Office 365 customer experience team. Myself and few other engineers thought you would all benefit from his knowledge of the Office 365 management activity API
A common question we get from organizations that move to Office 365 is, how do I get visibility into transactions that effect the information stored in Office 365. The security and compliance center and the Office 365 Management Activity API provide organizations with this visibility though detailed information with regards to user, admin, system, and policy actions and events from Office 365 and Azure Active Directory (Azure AD).
Reviewing the wealth of information available via the API and the audit logs, can be challenging though. Triaging detection results manually and categorizing related activities into groups can be difficult. The amounts of data generated from likely malicious activity can overwhelm investigators with irrelevant results. We know from experience the importance of accurate tooling, Microsoft Online Services processes petabytes of event monitoring data.
When Microsoft Online Services engineering started on the journey to view detection results as graphs we found that it enabled us to:
- evaluate intrusion detection results in context with related activity
- incorporate lower-fidelity indicators without being overwhelmed with benign results
- determine with greater fidelity when datacenter activity is likely to represent an intrusion
In this first post of our two-part series we will to help you understand how you can get the data necessary to perform a security analysis of it. The second post will focus on examples scenarios and using Power BI to visualize the data.
We are going to use Azure Cosmos DB, Azure Function Apps and cloud message queues to retrieve and store information. The data stores can be removed or purged, and the solution can be disabled or removed. Azure Cosmos DB also allows for the concept of TTL to expire content if you continue to synchronize the information. The sample graphs generated in this post were created with the free version of the ZoomCharts add-in for Power BI Desktop. Depending on your need there are several other graph add-ins available such as Network Navigator Chart and Force-Directed Graph. If you already have a method for obtaining data from the Activity API such as Azure Log Analytics , then continue to use that and access the information from Power BI which we briefly discuss in this post and go into more detail in next post.
1. Register an App with Azure Active Directory
Use this as a guide to create and register an application for making calls to the Office 365 Activity API. There are more detailed information about app registrations here. For this environment, the “Configure an X.509 certificate to enable service-to-service calls” is not necessary; it is enough to have an application with the appropriate permissions set. Don’t forget to complete the Administrator consent.
2. Setting up the infrastructure to push the Office 365 activities
The first step is to push the information you need to a store. We’ll use this sample from GitHub https://github.com/OfficeDev/O365-ActivityFeed-AzureFunction that allow you to push the past seven days of Office 365 Activity data to an instance of Azure Cosmos DB. You can limit the number of days and the workloads as needed. The code is created to run in two Azure Functions (PowerShell is currently in preview).
- Azure Function 1 places activity messages in a cloud message queue.
- Azure Function 2 picks up messages from that queue and transmits them to Azure Cosmos DB.
1. Create Function 1. (QueueEvents.ps1)
Remember to register a new Application in Azure Active Directory with adequate permissions before you take these steps.
If you don’t already have a Function App start to create one. By default, runtime is limited to 5 minutes for the functions running under the consumption plans, however, you can increase the runtime up to 10 minutes. An alternative is to use the App Consumption plan if you expect longer execution times. The consumption plans typically cover the need for retrieving the event data.
Create a New Function in the Function App
Enable experimental Language support, select Timer trigger and PowerShell.
Name the new function, and select the schedule for the trigger, which determines how often the function will pull data. A workload.log file is used to keep track of time to prevent duplicate requests.
Next, paste the code for function 1., QueueEvents.ps1 to the function.
Adjust the variables for sign in based on the AAD application registered. The Tenant GUID can be found under the Endpoints in the app registration. It is listed as part of the endpoints.
We will come back to adjust the storage variables shortly as part of the integration of the storage queues. Optionally modify the included workloads or message size. Note that reducing message size will increase the number of times Azure Function 2 is run. Making message size too large (for example, > 100) may cause you to exceed the limits of the queue and reduce performance.
Next, select integrate and add an Azure Queue Storage output. The queue name is specified using the $storageQueue variable use ‘outQueue’with single quotes unless you changed the queue name in the output settings. Click, Show Value on the “Storage account connection” and copy the Account key value to $StorageAccountKey and the AccountName to $StorageAccountName. These steps are required to use cloud queue functionality. A regular storage queue call does not allow for multiple objects.
Do verify that the queue was created, there have been some instances in the testing where they weren’t. In that case create a queue manually in the associated storage account.
2. Create Function 2. (StoreEvents.ps1)
Follow these steps to create the second function, which is a Queue trigger. Create a new Function in the previously created Function App. Provide a Queue name and the storage account defined in Function 1.
Add the code StoreEvents.ps1 and the information for the auth variables. The $triggerInput variable is the message parameter name.
Select Integrate and add a Cosmos DB. The $outputdocument variable is based on the Document parameter name. If you change the name, you must also change the name of the variable. Click Show Value for “Azure Cosmos DB account connection” and store the account key for making requests from Power BI (an alternative is to navigate to the Cosmos DB and use a read-only key).
If you don’t already have an Azure Cosmos DB in place create a new database before creating the output. If you don’t have a Cosmos DB and collection, ensure to set the checkbox to create the Azure Cosmos DB and collection.
3. Start the functions.
If you haven’t enabled the Office 365 Activity API subscriptions that is the first step to take. There is a sample script for how to enable the subscriptions at the GitHub page it can be run from on-premises (Enablesubscription.ps1). Do enable Office 365 audit log search as well.
When configuring a start date for retrieving data, note that the maximum time span is the past 7 days based on Activity API restrictions.
If you change variable $StoredTime = Get-content $Tracker to a date in the format of “yyyy-MM-ddTHH:mm:ss.fffZ” the workloads will use it as the starting point (e.g., $StoredTime = “2018-04-12T01:34:18.702Z”). Either disable the function after it has completed a first run or replace it with Get-content $Tracker as the next scheduled run will process the same data if not adjusted.
Alternatively, you can use Azure Storage Explorer and add these files with your desired start time to the root of the Azure functions blob store:
- Audit.AzureActiveDirectory.log
- Audit.SharePoint.log
- Audit.Exchange.log
- Audit.General.log
- DLP.All.log
The only thing you need in the file is the date example “2018-03-27T11:34:18.702Z” without the quotation marks. The log files allow for continuous synch excluding content previously synchronized.
When the functions are started, invocation logs will indicate if there are any issues. Use Azure Storage Explorer to view the storage queues.
If the function for some reason breaks the workload.log files will not be updated, and the function will start from the date last stamped in the workload.log file. There may be some overlap, but the analysis tools will identify any duplicates.
Ensure that the data is reaching your Cosmos DB instance by navigating to the Database, as shown below.
3. Open the data in Power BI
Download the Power BI Desktop client and the ZoomCharts referenced previously. Select to connect to Azure Cosmos DB in the Power BI desktop client.
Specify your connection string, etc., and optionally specify a query to limit the scope to the asset you want to investigate. Do remember that everything is case sensitive. In this case I have scoped it down to a specific site. Please see the GitHub page for more query samples. The subsequent step will require the Cosmos DB storage key that you stored as part of setting up the Cosmos DB.
Expand the columns by selecting the expand arrows. When done close and apply.
Import the Zoomchart visual if you haven’t completed that step previously.
Load the Nodes you want to review and the Measure.
Change the Measure to count to make the node sizes reflect the actual number of occurrences as an example
In many cases you can export csv files or directly make relationships to existing data and join it with the activity data. This is an example where we imported a few admin accounts from adminlist.csv. It could just as well be a number of files or ip addresses for which you need more information. We loaded the csv file.
In the next step we went to Relationships and joined the Adminlist with the UserID field to allow us to eliminate all accounts but those we are investigating.
In the visual level filter, we removed any account but those we are investigating
Summary
We have provided you with a starting point for how to analyze Office 365 Data using Power BI. The data can be pivoted and analyzed in many ways. Templates and continuously pulling the Activity Data can be used to quickly load data and draw conclusions from the wealth of information. Other event sources such as on premises Intrusion Detection Systems, Information classification systems or Azure Information Protection may be used to join with the activity data to improve visibility.
Our next post will provide more examples of analyzing information using Graphs.
If you have any feedback please provide it at the GitHub project page or by emailing it to cxprad@microsoft.com.
We look forward to hearing from you!
—Jon Nordstrom, senior program manager, Office 365 customer experience
The following is provided from Microsoft Security and Compliance blogs at TechCommunity:
Publishers note: I am posting this on behalf my colleague Jon Nordstrom who is part of the Office 365 customer experience team. Myself and few other engineers thought you would all benefit from his knowledge of the Office 365 management activity API
A common question we get from organizations that move to Office 365 is, how do I get visibility into transactions that effect the information stored in Office 365. The security and compliance center and the Office 365 Management Activity API provide organizations with this visibility though detailed information with regards to user, admin, system, and policy actions and events from Office 365 and Azure Active Directory (Azure AD).
Reviewing the wealth of information available via the API and the audit logs, can be challenging though. Triaging detection results manually and categorizing related activities into groups can be difficult. The amounts of data generated from likely malicious activity can overwhelm investigators with irrelevant results. We know from experience the importance of accurate tooling, Microsoft Online Services processes petabytes of event monitoring data.
When Microsoft Online Services engineering started on the journey to view detection results as graphs we found that it enabled us to:
- evaluate intrusion detection results in context with related activity
- incorporate lower-fidelity indicators without being overwhelmed with benign results
- determine with greater fidelity when datacenter activity is likely to represent an intrusion
In this first post of our two-part series we will to help you understand how you can get the data necessary to perform a security analysis of it. The second post will focus on examples scenarios and using Power BI to visualize the data.
We are going to use Azure Cosmos DB, Azure Function Apps and cloud message queues to retrieve and store information. The data stores can be removed or purged, and the solution can be disabled or removed. Azure Cosmos DB also allows for the concept of TTL to expire content if you continue to synchronize the information. The sample graphs generated in this post were created with the free version of the ZoomCharts add-in for Power BI Desktop. Depending on your need there are several other graph add-ins available such as Network Navigator Chart and Force-Directed Graph. If you already have a method for obtaining data from the Activity API such as Azure Log Analytics , then continue to use that and access the information from Power BI which we briefly discuss in this post and go into more detail in next post.
1. Register an App with Azure Active Directory
Use this as a guide to create and register an application for making calls to the Office 365 Activity API. There are more detailed information about app registrations here. For this environment, the “Configure an X.509 certificate to enable service-to-service calls” is not necessary; it is enough to have an application with the appropriate permissions set. Don’t forget to complete the Administrator consent.
2. Setting up the infrastructure to push the Office 365 activities
The first step is to push the information you need to a store. We’ll use this sample from GitHub https://github.com/OfficeDev/O365-ActivityFeed-AzureFunction that allow you to push the past seven days of Office 365 Activity data to an instance of Azure Cosmos DB. You can limit the number of days and the workloads as needed. The code is created to run in two Azure Functions (PowerShell is currently in preview).
- Azure Function 1 places activity messages in a cloud message queue.
- Azure Function 2 picks up messages from that queue and transmits them to Azure Cosmos DB.
1. Create Function 1. (QueueEvents.ps1)
Remember to register a new Application in Azure Active Directory with adequate permissions before you take these steps.
If you don’t already have a Function App start to create one. By default, runtime is limited to 5 minutes for the functions running under the consumption plans, however, you can increase the runtime up to 10 minutes. An alternative is to use the App Consumption plan if you expect longer execution times. The consumption plans typically cover the need for retrieving the event data.
Create a New Function in the Function App
Enable experimental Language support, select Timer trigger and PowerShell.
Name the new function, and select the schedule for the trigger, which determines how often the function will pull data. A workload.log file is used to keep track of time to prevent duplicate requests.
Next, paste the code for function 1., QueueEvents.ps1 to the function.
Adjust the variables for sign in based on the AAD application registered. The Tenant GUID can be found under the Endpoints in the app registration. It is listed as part of the endpoints.
We will come back to adjust the storage variables shortly as part of the integration of the storage queues. Optionally modify the included workloads or message size. Note that reducing message size will increase the number of times Azure Function 2 is run. Making message size too large (for example, > 100) may cause you to exceed the limits of the queue and reduce performance.
Next, select integrate and add an Azure Queue Storage output. The queue name is specified using the $storageQueue variable use ‘outQueue’with single quotes unless you changed the queue name in the output settings. Click, Show Value on the “Storage account connection” and copy the Account key value to $StorageAccountKey and the AccountName to $StorageAccountName. These steps are required to use cloud queue functionality. A regular storage queue call does not allow for multiple objects.
Do verify that the queue was created, there have been some instances in the testing where they weren’t. In that case create a queue manually in the associated storage account.
2. Create Function 2. (StoreEvents.ps1)
Follow these steps to create the second function, which is a Queue trigger. Create a new Function in the previously created Function App. Provide a Queue name and the storage account defined in Function 1.
Add the code StoreEvents.ps1 and the information for the auth variables. The $triggerInput variable is the message parameter name.
Select Integrate and add a Cosmos DB. The $outputdocument variable is based on the Document parameter name. If you change the name, you must also change the name of the variable. Click Show Value for “Azure Cosmos DB account connection” and store the account key for making requests from Power BI (an alternative is to navigate to the Cosmos DB and use a read-only key).
If you don’t already have an Azure Cosmos DB in place create a new database before creating the output. If you don’t have a Cosmos DB and collection, ensure to set the checkbox to create the Azure Cosmos DB and collection.
3. Start the functions.
If you haven’t enabled the Office 365 Activity API subscriptions that is the first step to take. There is a sample script for how to enable the subscriptions at the GitHub page it can be run from on-premises (Enablesubscription.ps1). Do enable Office 365 audit log search as well.
When configuring a start date for retrieving data, note that the maximum time span is the past 7 days based on Activity API restrictions.
If you change variable $StoredTime = Get-content $Tracker to a date in the format of “yyyy-MM-ddTHH:mm:ss.fffZ” the workloads will use it as the starting point (e.g., $StoredTime = “2018-04-12T01:34:18.702Z”). Either disable the function after it has completed a first run or replace it with Get-content $Tracker as the next scheduled run will process the same data if not adjusted.
Alternatively, you can use Azure Storage Explorer and add these files with your desired start time to the root of the Azure functions blob store:
- Audit.AzureActiveDirectory.log
- Audit.SharePoint.log
- Audit.Exchange.log
- Audit.General.log
- DLP.All.log
The only thing you need in the file is the date example “2018-03-27T11:34:18.702Z” without the quotation marks. The log files allow for continuous synch excluding content previously synchronized.
When the functions are started, invocation logs will indicate if there are any issues. Use Azure Storage Explorer to view the storage queues.
If the function for some reason breaks the workload.log files will not be updated, and the function will start from the date last stamped in the workload.log file. There may be some overlap, but the analysis tools will identify any duplicates.
Ensure that the data is reaching your Cosmos DB instance by navigating to the Database, as shown below.
3. Open the data in Power BI
Download the Power BI Desktop client and the ZoomCharts referenced previously. Select to connect to Azure Cosmos DB in the Power BI desktop client.
Specify your connection string, etc., and optionally specify a query to limit the scope to the asset you want to investigate. Do remember that everything is case sensitive. In this case I have scoped it down to a specific site. Please see the GitHub page for more query samples. The subsequent step will require the Cosmos DB storage key that you stored as part of setting up the Cosmos DB.
Expand the columns by selecting the expand arrows. When done close and apply.
Import the Zoomchart visual if you haven’t completed that step previously.
Load the Nodes you want to review and the Measure.
Change the Measure to count to make the node sizes reflect the actual number of occurrences as an example
In many cases you can export csv files or directly make relationships to existing data and join it with the activity data. This is an example where we imported a few admin accounts from adminlist.csv. It could just as well be a number of files or ip addresses for which you need more information. We loaded the csv file.
In the next step we went to Relationships and joined the Adminlist with the UserID field to allow us to eliminate all accounts but those we are investigating.
In the visual level filter, we removed any account but those we are investigating
Summary
We have provided you with a starting point for how to analyze Office 365 Data using Power BI. The data can be pivoted and analyzed in many ways. Templates and continuously pulling the Activity Data can be used to quickly load data and draw conclusions from the wealth of information. Other event sources such as on premises Intrusion Detection Systems, Information classification systems or Azure Information Protection may be used to join with the activity data to improve visibility.
Our next post will provide more examples of analyzing information using Graphs.
If you have any feedback please provide it at the GitHub project page or by emailing it to cxprad@microsoft.com.
We look forward to hearing from you!
—Jon Nordstrom, senior program manager, Office 365 customer experience
The above was provided from Microsoft Security and Compliance blogs at TechCommunity
Publishers note: I am posting this on behalf my colleague Jon Nordstrom who is part of the Office 365 customer experience team. Myself and few other engineers thought you would all benefit from his knowledge of the Office 365 management activity API
A common question we get from organizations that move to Office 365 is, how do I get visibility into transactions that effect the information stored in Office 365. The security and compliance center and the Office 365 Management Activity API provide organizations with this visibility though detailed information with regards to user, admin, system, and policy actions and events from Office 365 and Azure Active Directory (Azure AD).
Reviewing the wealth of information available via the API and the audit logs, can be challenging though. Triaging detection results manually and categorizing related activities into groups can be difficult. The amounts of data generated from likely malicious activity can overwhelm investigators with irrelevant results. We know from experience the importance of accurate tooling, Microsoft Online Services processes petabytes of event monitoring data.
When Microsoft Online Services engineering started on the journey to view detection results as graphs we found that it enabled us to:
- evaluate intrusion detection results in context with related activity
- incorporate lower-fidelity indicators without being overwhelmed with benign results
- determine with greater fidelity when datacenter activity is likely to represent an intrusion
In this first post of our two-part series we will to help you understand how you can get the data necessary to perform a security analysis of it. The second post will focus on examples scenarios and using Power BI to visualize the data.
We are going to use Azure Cosmos DB, Azure Function Apps and cloud message queues to retrieve and store information. The data stores can be removed or purged, and the solution can be disabled or removed. Azure Cosmos DB also allows for the concept of TTL to expire content if you continue to synchronize the information. The sample graphs generated in this post were created with the free version of the ZoomCharts add-in for Power BI Desktop. Depending on your need there are several other graph add-ins available such as Network Navigator Chart and Force-Directed Graph. If you already have a method for obtaining data from the Activity API such as Azure Log Analytics , then continue to use that and access the information from Power BI which we briefly discuss in this post and go into more detail in next post.
1. Register an App with Azure Active Directory
Use this as a guide to create and register an application for making calls to the Office 365 Activity API. There are more detailed information about app registrations here. For this environment, the “Configure an X.509 certificate to enable service-to-service calls” is not necessary; it is enough to have an application with the appropriate permissions set. Don’t forget to complete the Administrator consent.
2. Setting up the infrastructure to push the Office 365 activities
The first step is to push the information you need to a store. We’ll use this sample from GitHub https://github.com/OfficeDev/O365-ActivityFeed-AzureFunction that allow you to push the past seven days of Office 365 Activity data to an instance of Azure Cosmos DB. You can limit the number of days and the workloads as needed. The code is created to run in two Azure Functions (PowerShell is currently in preview).
- Azure Function 1 places activity messages in a cloud message queue.
- Azure Function 2 picks up messages from that queue and transmits them to Azure Cosmos DB.
1. Create Function 1. (QueueEvents.ps1)
Remember to register a new Application in Azure Active Directory with adequate permissions before you take these steps.
If you don’t already have a Function App start to create one. By default, runtime is limited to 5 minutes for the functions running under the consumption plans, however, you can increase the runtime up to 10 minutes. An alternative is to use the App Consumption plan if you expect longer execution times. The consumption plans typically cover the need for retrieving the event data.
Create a New Function in the Function App
Enable experimental Language support, select Timer trigger and PowerShell.
Name the new function, and select the schedule for the trigger, which determines how often the function will pull data. A workload.log file is used to keep track of time to prevent duplicate requests.
Next, paste the code for function 1., QueueEvents.ps1 to the function.
Adjust the variables for sign in based on the AAD application registered. The Tenant GUID can be found under the Endpoints in the app registration. It is listed as part of the endpoints.
We will come back to adjust the storage variables shortly as part of the integration of the storage queues. Optionally modify the included workloads or message size. Note that reducing message size will increase the number of times Azure Function 2 is run. Making message size too large (for example, > 100) may cause you to exceed the limits of the queue and reduce performance.
Next, select integrate and add an Azure Queue Storage output. The queue name is specified using the $storageQueue variable use ‘outQueue’with single quotes unless you changed the queue name in the output settings. Click, Show Value on the “Storage account connection” and copy the Account key value to $StorageAccountKey and the AccountName to $StorageAccountName. These steps are required to use cloud queue functionality. A regular storage queue call does not allow for multiple objects.
Do verify that the queue was created, there have been some instances in the testing where they weren’t. In that case create a queue manually in the associated storage account.
2. Create Function 2. (StoreEvents.ps1)
Follow these steps to create the second function, which is a Queue trigger. Create a new Function in the previously created Function App. Provide a Queue name and the storage account defined in Function 1.
Add the code StoreEvents.ps1 and the information for the auth variables. The $triggerInput variable is the message parameter name.
Select Integrate and add a Cosmos DB. The $outputdocument variable is based on the Document parameter name. If you change the name, you must also change the name of the variable. Click Show Value for “Azure Cosmos DB account connection” and store the account key for making requests from Power BI (an alternative is to navigate to the Cosmos DB and use a read-only key).
If you don’t already have an Azure Cosmos DB in place create a new database before creating the output. If you don’t have a Cosmos DB and collection, ensure to set the checkbox to create the Azure Cosmos DB and collection.
3. Start the functions.
If you haven’t enabled the Office 365 Activity API subscriptions that is the first step to take. There is a sample script for how to enable the subscriptions at the GitHub page it can be run from on-premises (Enablesubscription.ps1). Do enable Office 365 audit log search as well.
When configuring a start date for retrieving data, note that the maximum time span is the past 7 days based on Activity API restrictions.
If you change variable $StoredTime = Get-content $Tracker to a date in the format of “yyyy-MM-ddTHH:mm:ss.fffZ” the workloads will use it as the starting point (e.g., $StoredTime = “2018-04-12T01:34:18.702Z”). Either disable the function after it has completed a first run or replace it with Get-content $Tracker as the next scheduled run will process the same data if not adjusted.
Alternatively, you can use Azure Storage Explorer and add these files with your desired start time to the root of the Azure functions blob store:
- Audit.AzureActiveDirectory.log
- Audit.SharePoint.log
- Audit.Exchange.log
- Audit.General.log
- DLP.All.log
The only thing you need in the file is the date example “2018-03-27T11:34:18.702Z” without the quotation marks. The log files allow for continuous synch excluding content previously synchronized.
When the functions are started, invocation logs will indicate if there are any issues. Use Azure Storage Explorer to view the storage queues.
If the function for some reason breaks the workload.log files will not be updated, and the function will start from the date last stamped in the workload.log file. There may be some overlap, but the analysis tools will identify any duplicates.
Ensure that the data is reaching your Cosmos DB instance by navigating to the Database, as shown below.
3. Open the data in Power BI
Download the Power BI Desktop client and the ZoomCharts referenced previously. Select to connect to Azure Cosmos DB in the Power BI desktop client.
Specify your connection string, etc., and optionally specify a query to limit the scope to the asset you want to investigate. Do remember that everything is case sensitive. In this case I have scoped it down to a specific site. Please see the GitHub page for more query samples. The subsequent step will require the Cosmos DB storage key that you stored as part of setting up the Cosmos DB.
Expand the columns by selecting the expand arrows. When done close and apply.
Import the Zoomchart visual if you haven’t completed that step previously.
Load the Nodes you want to review and the Measure.
Change the Measure to count to make the node sizes reflect the actual number of occurrences as an example
In many cases you can export csv files or directly make relationships to existing data and join it with the activity data. This is an example where we imported a few admin accounts from adminlist.csv. It could just as well be a number of files or ip addresses for which you need more information. We loaded the csv file.
In the next step we went to Relationships and joined the Adminlist with the UserID field to allow us to eliminate all accounts but those we are investigating.
In the visual level filter, we removed any account but those we are investigating
Summary
We have provided you with a starting point for how to analyze Office 365 Data using Power BI. The data can be pivoted and analyzed in many ways. Templates and continuously pulling the Activity Data can be used to quickly load data and draw conclusions from the wealth of information. Other event sources such as on premises Intrusion Detection Systems, Information classification systems or Azure Information Protection may be used to join with the activity data to improve visibility.
Our next post will provide more examples of analyzing information using Graphs.
If you have any feedback please provide it at the GitHub project page or by emailing it to cxprad@microsoft.com.
We look forward to hearing from you!
—Jon Nordstrom, senior program manager, Office 365 customer experience
Publishers note: I am posting this on behalf my colleague Jon Nordstrom who is part of the Office 365 customer experience team. Myself and few other engineers thought you would all benefit from his knowledge of the Office 365 management activity API.
Once you have the data you need for your investigation, it can be helpful to use graphs to analyze activity data to identify relationships and outliers during an investigation. On TechNet we shared how the Office 365 team uses graphs to analyze incident data but in this last post of our two-part series we will focus on using Power BI to visualize the data for the following scenarios:
A. What changes have been made to my environment by Exchange administrators?
B. Is there excessive sign in failures from specific IP addresses?
C. Who has accessed sensitive content?
To help you understand how you can get the data necessary to perform a security analysis of it check out the previous post here.
The sample graphs generated in this post were created with the free version of the ZoomCharts add-in for Power BI Desktop. The data was transferred to Azure Cosmos DB using these sample scripts.
Use Cases
A. What changes were made to my environment by Exchange administrators?
What operations can I expect of my Exchange Online administrators and what operations do they have in common? Has an account run any commands that allow for access to user data? Are there any connections between these operations?
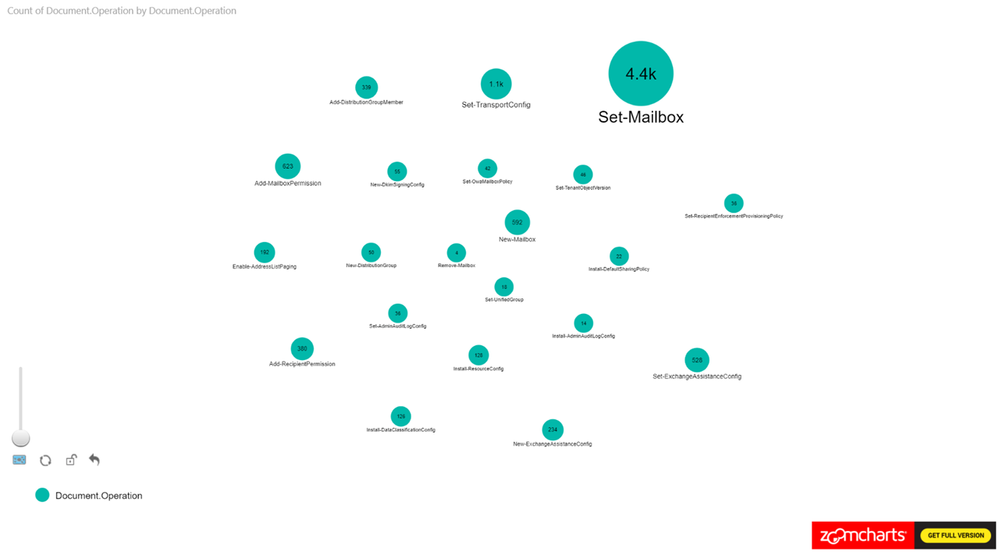
Figure 1 is a sample where we are only looking at the Exchange Operations. Looking at the pure count of operations may be good for alerts but how is it all connected?
To filter on Exchange Online events from Power BI, search the Fields pane for “workloads”, drag the workloads field to Page level filters and select the workload to filter on. When working with large sets of data either filter the information on import to Power BI or add a page level filter for Exchange operations.
Figure 1
Let’s expand this scenario to understand the actors, since the operations in isolation doesn’t provide us with the data needed for an investigation.
In this example, we set the Nodes to Operations and UserId. The Measure is set to Operations see Figure 2 for the configuration.
This is a new tenant with many new accounts, so it is expected to see operations performed by the service itself as identified by “NT AUTHORITYSYSTEM” within the logs. You can identify cmdlets that are shared between actors and cmdlets that are unique to specific actors.
 Figure 2
As a next step add the ObjectID to the Power BI view. The number of operations that have been carried out is shown along with any user objects that have been modified. We can see a cluster forming around one of the administrator accounts. As a next step we are zooming in to that cluster.
 Figure 3
When zooming in on the cluster we can see Add-MailboxPermissions being run on several mailboxes. If this was to occur in a production tenant it should raise some flags.
 Figure 4
The next step is to filter and understand permissions that have been provisioned. You can add a table that is filtered based on the graphs. In this example, the Administrator has granted FullAccess to these mailboxes. Not a best practice… This information can be used to reverse the change by exporting the data to a csv file and loop through the modified mailboxes using Remove-MailboxPermissions.
 Figure 5
B. Is there excessive sign in failures from specific IP addresses?
This example was derived from a test of the Password Spray attack simulation from the Attack Simulator feature in Office 365 Threat Intelligence. One key element of creating this view is to remember to exclude internal proxies, etc., from filtering to get a representative view. IP addresses with a high ratio of failures will beacon clearly in the report even when the report contains a lot of data. Look for how data is clustered together.
As can be seen in Figure 6., we have loaded UserId, ActorIpAddress, Operation as nodes and we are using the count of UserID as the measure.
 Figure 6
C. Who has accessed sensitive content?
This example is based on filtering SharePoint Online and OneDrive for Business activity to identify users who have accessed information that has the “Acquisition documentation policy enforcement” label policy applied. This view can be used to understand if new sensitive content is accessed. The policy creates an account that is used to update the sensitive content and we can use the account to link to the usage.
From Figure 7., you can see that we have been using Operation, UserID, ObjectID for the nodes and loaded count of operations as the measure.
 Figure 7
Summary
This post hopefully peak your interest in Graph based security analysis. If you think that analyzing data in Graphs seems like something that your organization may benefit from we hope that we have helped you get started.
We have only scratched the surface though. There are many scenarios where this may be a useful approach to get a deeper understanding. Go ahead and use the steps from the first post in the series to setup your own environment and work on your own model for Graph based analysis.
If you have any feedback please provide it at the GitHub project page or by emailing it to cxprad@microsoft.com.
We look forward to hearing from you!
—Jon Nordstrom, senior program manager, Office 365 customer experience
Publishers note: I am posting this on behalf my colleague Jon Nordstrom who is part of the Office 365 customer experience team. Myself and few other engineers thought you would all benefit from his knowledge of the Office 365 management activity API.
Once you have the data you need for your investigation, it can be helpful to use graphs to analyze activity data to identify relationships and outliers during an investigation. On TechNet we shared how the Office 365 team uses graphs to analyze incident data but in this last post of our two-part series we will focus on using Power BI to visualize the data for the following scenarios:
A. What changes have been made to my environment by Exchange administrators?
B. Is there excessive sign in failures from specific IP addresses?
C. Who has accessed sensitive content?
To help you understand how you can get the data necessary to perform a security analysis of it check out the previous post here.
The sample graphs generated in this post were created with the free version of the ZoomCharts add-in for Power BI Desktop. The data was transferred to Azure Cosmos DB using these sample scripts.
Use Cases
A. What changes were made to my environment by Exchange administrators?
What operations can I expect of my Exchange Online administrators and what operations do they have in common? Has an account run any commands that allow for access to user data? Are there any connections between these operations?
Figure 1 is a sample where we are only looking at the Exchange Operations. Looking at the pure count of operations may be good for alerts but how is it all connected?
To filter on Exchange Online events from Power BI, search the Fields pane for “workloads”, drag the workloads field to Page level filters and select the workload to filter on. When working with large sets of data either filter the information on import to Power BI or add a page level filter for Exchange operations.
Figure 1
Let’s expand this scenario to understand the actors, since the operations in isolation doesn’t provide us with the data needed for an investigation.
In this example, we set the Nodes to Operations and UserId. The Measure is set to Operations see Figure 2 for the configuration.
This is a new tenant with many new accounts, so it is expected to see operations performed by the service itself as identified by “NT AUTHORITYSYSTEM” within the logs. You can identify cmdlets that are shared between actors and cmdlets that are unique to specific actors.
Figure 2
As a next step add the ObjectID to the Power BI view. The number of operations that have been carried out is shown along with any user objects that have been modified. We can see a cluster forming around one of the administrator accounts. As a next step we are zooming in to that cluster.
Figure 3
When zooming in on the cluster we can see Add-MailboxPermissions being run on several mailboxes. If this was to occur in a production tenant it should raise some flags.
Figure 4
The next step is to filter and understand permissions that have been provisioned. You can add a table that is filtered based on the graphs. In this example, the Administrator has granted FullAccess to these mailboxes. Not a best practice… This information can be used to reverse the change by exporting the data to a csv file and loop through the modified mailboxes using Remove-MailboxPermissions.
Figure 5
B. Is there excessive sign in failures from specific IP addresses?
This example was derived from a test of the Password Spray attack simulation from the Attack Simulator feature in Office 365 Threat Intelligence. One key element of creating this view is to remember to exclude internal proxies, etc., from filtering to get a representative view. IP addresses with a high ratio of failures will beacon clearly in the report even when the report contains a lot of data. Look for how data is clustered together.
As can be seen in Figure 6., we have loaded UserId, ActorIpAddress, Operation as nodes and we are using the count of UserID as the measure.
Figure 6
C. Who has accessed sensitive content?
This example is based on filtering SharePoint Online and OneDrive for Business activity to identify users who have accessed information that has the “Acquisition documentation policy enforcement” label policy applied. This view can be used to understand if new sensitive content is accessed. The policy creates an account that is used to update the sensitive content and we can use the account to link to the usage.
From Figure 7., you can see that we have been using Operation, UserID, ObjectID for the nodes and loaded count of operations as the measure.
Figure 7
Summary
This post hopefully peak your interest in Graph based security analysis. If you think that analyzing data in Graphs seems like something that your organization may benefit from we hope that we have helped you get started.
We have only scratched the surface though. There are many scenarios where this may be a useful approach to get a deeper understanding. Go ahead and use the steps from the first post in the series to setup your own environment and work on your own model for Graph based analysis.
If you have any feedback please provide it at the GitHub project page or by emailing it to cxprad@microsoft.com.
We look forward to hearing from you!
—Jon Nordstrom, senior program manager, Office 365 customer experience
The following is provided from Microsoft Security and Compliance blogs at TechCommunity:
Publishers note: I am posting this on behalf my colleague Jon Nordstrom who is part of the Office 365 customer experience team. Myself and few other engineers thought you would all benefit from his knowledge of the Office 365 management activity API.
Once you have the data you need for your investigation, it can be helpful to use graphs to analyze activity data to identify relationships and outliers during an investigation. On TechNet we shared how the Office 365 team uses graphs to analyze incident data but in this last post of our two-part series we will focus on using Power BI to visualize the data for the following scenarios:
A. What changes have been made to my environment by Exchange administrators?
B. Is there excessive sign in failures from specific IP addresses?
C. Who has accessed sensitive content?
To help you understand how you can get the data necessary to perform a security analysis of it check out the previous post here.
The sample graphs generated in this post were created with the free version of the ZoomCharts add-in for Power BI Desktop. The data was transferred to Azure Cosmos DB using these sample scripts.
Use Cases
A. What changes were made to my environment by Exchange administrators?
What operations can I expect of my Exchange Online administrators and what operations do they have in common? Has an account run any commands that allow for access to user data? Are there any connections between these operations?
Figure 1 is a sample where we are only looking at the Exchange Operations. Looking at the pure count of operations may be good for alerts but how is it all connected?
To filter on Exchange Online events from Power BI, search the Fields pane for “workloads”, drag the workloads field to Page level filters and select the workload to filter on. When working with large sets of data either filter the information on import to Power BI or add a page level filter for Exchange operations.
Figure 1
Let’s expand this scenario to understand the actors, since the operations in isolation doesn’t provide us with the data needed for an investigation.
In this example, we set the Nodes to Operations and UserId. The Measure is set to Operations see Figure 2 for the configuration.
This is a new tenant with many new accounts, so it is expected to see operations performed by the service itself as identified by “NT AUTHORITYSYSTEM” within the logs. You can identify cmdlets that are shared between actors and cmdlets that are unique to specific actors.
Figure 2
As a next step add the ObjectID to the Power BI view. The number of operations that have been carried out is shown along with any user objects that have been modified. We can see a cluster forming around one of the administrator accounts. As a next step we are zooming in to that cluster.
Figure 3
When zooming in on the cluster we can see Add-MailboxPermissions being run on several mailboxes. If this was to occur in a production tenant it should raise some flags.
Figure 4
The next step is to filter and understand permissions that have been provisioned. You can add a table that is filtered based on the graphs. In this example, the Administrator has granted FullAccess to these mailboxes. Not a best practice… This information can be used to reverse the change by exporting the data to a csv file and loop through the modified mailboxes using Remove-MailboxPermissions.
Figure 5
B. Is there excessive sign in failures from specific IP addresses?
This example was derived from a test of the Password Spray attack simulation from the Attack Simulator feature in Office 365 Threat Intelligence. One key element of creating this view is to remember to exclude internal proxies, etc., from filtering to get a representative view. IP addresses with a high ratio of failures will beacon clearly in the report even when the report contains a lot of data. Look for how data is clustered together.
As can be seen in Figure 6., we have loaded UserId, ActorIpAddress, Operation as nodes and we are using the count of UserID as the measure.
Figure 6
C. Who has accessed sensitive content?
This example is based on filtering SharePoint Online and OneDrive for Business activity to identify users who have accessed information that has the “Acquisition documentation policy enforcement” label policy applied. This view can be used to understand if new sensitive content is accessed. The policy creates an account that is used to update the sensitive content and we can use the account to link to the usage.
From Figure 7., you can see that we have been using Operation, UserID, ObjectID for the nodes and loaded count of operations as the measure.
Figure 7
Summary
This post hopefully peak your interest in Graph based security analysis. If you think that analyzing data in Graphs seems like something that your organization may benefit from we hope that we have helped you get started.
We have only scratched the surface though. There are many scenarios where this may be a useful approach to get a deeper understanding. Go ahead and use the steps from the first post in the series to setup your own environment and work on your own model for Graph based analysis.
If you have any feedback please provide it at the GitHub project page or by emailing it to cxprad@microsoft.com.
We look forward to hearing from you!
—Jon Nordstrom, senior program manager, Office 365 customer experience
The above was provided from Microsoft Security and Compliance blogs at TechCommunity
Publishers note: I am posting this on behalf my colleague Jon Nordstrom who is part of the Office 365 customer experience team. Myself and few other engineers thought you would all benefit from his knowledge of the Office 365 management activity API.
Once you have the data you need for your investigation, it can be helpful to use graphs to analyze activity data to identify relationships and outliers during an investigation. On TechNet we shared how the Office 365 team uses graphs to analyze incident data but in this last post of our two-part series we will focus on using Power BI to visualize the data for the following scenarios:
A. What changes have been made to my environment by Exchange administrators?
B. Is there excessive sign in failures from specific IP addresses?
C. Who has accessed sensitive content?
To help you understand how you can get the data necessary to perform a security analysis of it check out the previous post here.
The sample graphs generated in this post were created with the free version of the ZoomCharts add-in for Power BI Desktop. The data was transferred to Azure Cosmos DB using these sample scripts.
Use Cases
A. What changes were made to my environment by Exchange administrators?
What operations can I expect of my Exchange Online administrators and what operations do they have in common? Has an account run any commands that allow for access to user data? Are there any connections between these operations?
Figure 1 is a sample where we are only looking at the Exchange Operations. Looking at the pure count of operations may be good for alerts but how is it all connected?
To filter on Exchange Online events from Power BI, search the Fields pane for “workloads”, drag the workloads field to Page level filters and select the workload to filter on. When working with large sets of data either filter the information on import to Power BI or add a page level filter for Exchange operations.
Figure 1
Let’s expand this scenario to understand the actors, since the operations in isolation doesn’t provide us with the data needed for an investigation.
In this example, we set the Nodes to Operations and UserId. The Measure is set to Operations see Figure 2 for the configuration.
This is a new tenant with many new accounts, so it is expected to see operations performed by the service itself as identified by “NT AUTHORITYSYSTEM” within the logs. You can identify cmdlets that are shared between actors and cmdlets that are unique to specific actors.
Figure 2
As a next step add the ObjectID to the Power BI view. The number of operations that have been carried out is shown along with any user objects that have been modified. We can see a cluster forming around one of the administrator accounts. As a next step we are zooming in to that cluster.
Figure 3
When zooming in on the cluster we can see Add-MailboxPermissions being run on several mailboxes. If this was to occur in a production tenant it should raise some flags.
Figure 4
The next step is to filter and understand permissions that have been provisioned. You can add a table that is filtered based on the graphs. In this example, the Administrator has granted FullAccess to these mailboxes. Not a best practice… This information can be used to reverse the change by exporting the data to a csv file and loop through the modified mailboxes using Remove-MailboxPermissions.
Figure 5
B. Is there excessive sign in failures from specific IP addresses?
This example was derived from a test of the Password Spray attack simulation from the Attack Simulator feature in Office 365 Threat Intelligence. One key element of creating this view is to remember to exclude internal proxies, etc., from filtering to get a representative view. IP addresses with a high ratio of failures will beacon clearly in the report even when the report contains a lot of data. Look for how data is clustered together.
As can be seen in Figure 6., we have loaded UserId, ActorIpAddress, Operation as nodes and we are using the count of UserID as the measure.
Figure 6
C. Who has accessed sensitive content?
This example is based on filtering SharePoint Online and OneDrive for Business activity to identify users who have accessed information that has the “Acquisition documentation policy enforcement” label policy applied. This view can be used to understand if new sensitive content is accessed. The policy creates an account that is used to update the sensitive content and we can use the account to link to the usage.
From Figure 7., you can see that we have been using Operation, UserID, ObjectID for the nodes and loaded count of operations as the measure.
Figure 7
Summary
This post hopefully peak your interest in Graph based security analysis. If you think that analyzing data in Graphs seems like something that your organization may benefit from we hope that we have helped you get started.
We have only scratched the surface though. There are many scenarios where this may be a useful approach to get a deeper understanding. Go ahead and use the steps from the first post in the series to setup your own environment and work on your own model for Graph based analysis.
If you have any feedback please provide it at the GitHub project page or by emailing it to cxprad@microsoft.com.
We look forward to hearing from you!
—Jon Nordstrom, senior program manager, Office 365 customer experience
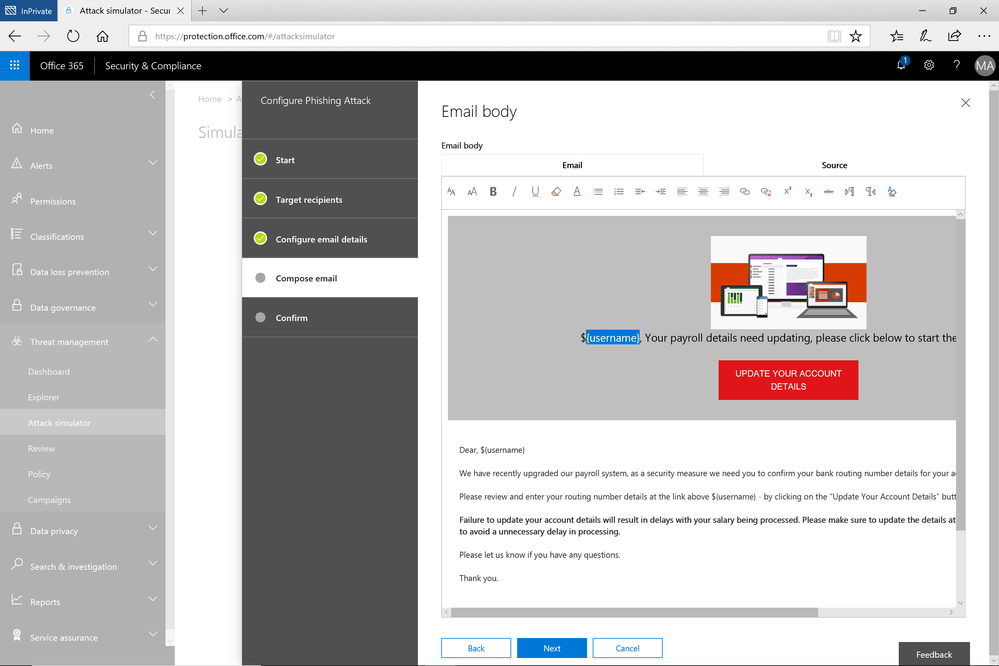
A few weeks ago, we released a public preview for Attack Simulator for Office 365 Threat Intelligence. Today, we’re excited to announce that Attack Simulator is now generally available. Attack Simulator for Office 365 Threat Intelligence is available to all Office 365 E5 or Office 365 Threat Intelligence customers.
With Attack Simulator, customers can launch simulated attacks on their end users, determine how end users behave in the event of an attack, and update policies and ensure that appropriate security tools are in place to protect the organization from threats. The GA of Attack Simulator adds a new HTML editor so realistic looking HTML emails can be sent in simulations of spear-phishing. Also, two spear-phishing templates are available for immediate use in the spear phishing simulation.
Figure 1. Email template for spear phish simulation using a fake email from an organization’s payroll department.
Attack Simulator includes the three attack scenarios from our public preview.
- Display Name Spear Phishing Attack: Phishing is the generic term for socially engineered attacks designed to harvest credentials or personally identifiable information (PII). Spear phishing is a subset of this phishing and is more targeted, often aimed at a specific group, individual, or organization. These attacks are customized and tend to leverage a sender name that generates trust with the recipient.
- Password Spray Attack: To prevent bad actors from constantly guessing the passwords of user accounts, often there are account lockout policies. For example, an account will lockout after a certain number of bad passwords are guessed for a user. However, if you were to take a single password and try it against every single account in an organization, it would not trigger any lockouts. The password spray attack leverages commonly used passwords and targets many accounts in an organization with the hope that one of the account holder uses a common password that allows a hacker to enter the account and take control of it. From this compromised account, a hacker can launch more attacks by assuming the identity of account holder.
- Brute Force Password Attack: This type of attack consists of a hacker trying many passwords or passphrases with the hope of eventually guessing correctly. The attacker systematically checks all possible passwords and passphrases until the correct one is found.
This video demonstrates how Attack Simulator can help organizations educate users to become more secure from cyber threats. With Attack Simulator, admins can train all their end users, and especially those who are attacked most often. This proactive training is a powerful way to ensure that your organization can prevent the impact from advanced threats. Over the coming months, more threat simulations will be added to Attack Simulator so organizations can simulate the most prevalent threat types from the modern threat landscape.
Begin Educating your End Users Today
Experience the benefits of Attack Simulator for Office 365 Threat Intelligence by beginning an Office 365 E5 trial or Office 365 Threat Intelligence Trial today. Also, learn more about how Microsoft leverages threat intelligence and the value of threat intelligence. Your feedback is one of the most important drivers of our innovation, so please let us know what you think.
The following is provided from Microsoft Security and Compliance blogs at TechCommunity:
A few weeks ago, we released a public preview for Attack Simulator for Office 365 Threat Intelligence. Today, we’re excited to announce that Attack Simulator is now generally available. Attack Simulator for Office 365 Threat Intelligence is available to all Office 365 E5 or Office 365 Threat Intelligence customers.
With Attack Simulator, customers can launch simulated attacks on their end users, determine how end users behave in the event of an attack, and update policies and ensure that appropriate security tools are in place to protect the organization from threats. The GA of Attack Simulator adds a new HTML editor so realistic looking HTML emails can be sent in simulations of spear-phishing. Also, two spear-phishing templates are available for immediate use in the spear phishing simulation.
Figure 1. Email template for spear phish simulation using a fake email from an organization’s payroll department.
Attack Simulator includes the three attack scenarios from our public preview.
- Display Name Spear Phishing Attack: Phishing is the generic term for socially engineered attacks designed to harvest credentials or personally identifiable information (PII). Spear phishing is a subset of this phishing and is more targeted, often aimed at a specific group, individual, or organization. These attacks are customized and tend to leverage a sender name that generates trust with the recipient.
- Password Spray Attack: To prevent bad actors from constantly guessing the passwords of user accounts, often there are account lockout policies. For example, an account will lockout after a certain number of bad passwords are guessed for a user. However, if you were to take a single password and try it against every single account in an organization, it would not trigger any lockouts. The password spray attack leverages commonly used passwords and targets many accounts in an organization with the hope that one of the account holder uses a common password that allows a hacker to enter the account and take control of it. From this compromised account, a hacker can launch more attacks by assuming the identity of account holder.
- Brute Force Password Attack: This type of attack consists of a hacker trying many passwords or passphrases with the hope of eventually guessing correctly. The attacker systematically checks all possible passwords and passphrases until the correct one is found.
This video demonstrates how Attack Simulator can help organizations educate users to become more secure from cyber threats. With Attack Simulator, admins can train all their end users, and especially those who are attacked most often. This proactive training is a powerful way to ensure that your organization can prevent the impact from advanced threats. Over the coming months, more threat simulations will be added to Attack Simulator so organizations can simulate the most prevalent threat types from the modern threat landscape.
Begin Educating your End Users Today
Experience the benefits of Attack Simulator for Office 365 Threat Intelligence by beginning an Office 365 E5 trial or Office 365 Threat Intelligence Trial today. Also, learn more about how Microsoft leverages threat intelligence and the value of threat intelligence. Your feedback is one of the most important drivers of our innovation, so please let us know what you think.
The above was provided from Microsoft Security and Compliance blogs at TechCommunity
A few weeks ago, we released a public preview for Attack Simulator for Office 365 Threat Intelligence. Today, we’re excited to announce that Attack Simulator is now generally available. Attack Simulator for Office 365 Threat Intelligence is available to all Office 365 E5 or Office 365 Threat Intelligence customers.
With Attack Simulator, customers can launch simulated attacks on their end users, determine how end users behave in the event of an attack, and update policies and ensure that appropriate security tools are in place to protect the organization from threats. The GA of Attack Simulator adds a new HTML editor so realistic looking HTML emails can be sent in simulations of spear-phishing. Also, two spear-phishing templates are available for immediate use in the spear phishing simulation.
Figure 1. Email template for spear phish simulation using a fake email from an organization’s payroll department.
Attack Simulator includes the three attack scenarios from our public preview.
- Display Name Spear Phishing Attack: Phishing is the generic term for socially engineered attacks designed to harvest credentials or personally identifiable information (PII). Spear phishing is a subset of this phishing and is more targeted, often aimed at a specific group, individual, or organization. These attacks are customized and tend to leverage a sender name that generates trust with the recipient.
- Password Spray Attack: To prevent bad actors from constantly guessing the passwords of user accounts, often there are account lockout policies. For example, an account will lockout after a certain number of bad passwords are guessed for a user. However, if you were to take a single password and try it against every single account in an organization, it would not trigger any lockouts. The password spray attack leverages commonly used passwords and targets many accounts in an organization with the hope that one of the account holder uses a common password that allows a hacker to enter the account and take control of it. From this compromised account, a hacker can launch more attacks by assuming the identity of account holder.
- Brute Force Password Attack: This type of attack consists of a hacker trying many passwords or passphrases with the hope of eventually guessing correctly. The attacker systematically checks all possible passwords and passphrases until the correct one is found.
This video demonstrates how Attack Simulator can help organizations educate users to become more secure from cyber threats. With Attack Simulator, admins can train all their end users, and especially those who are attacked most often. This proactive training is a powerful way to ensure that your organization can prevent the impact from advanced threats. Over the coming months, more threat simulations will be added to Attack Simulator so organizations can simulate the most prevalent threat types from the modern threat landscape.
Begin Educating your End Users Today
Experience the benefits of Attack Simulator for Office 365 Threat Intelligence by beginning an Office 365 E5 trial or Office 365 Threat Intelligence Trial today. Also, learn more about how Microsoft leverages threat intelligence and the value of threat intelligence. Your feedback is one of the most important drivers of our innovation, so please let us know what you think.
Event based retention is now generally available to help organizations manage retention of content based on a certain event trigger. Whether an employee departure, or the close of a project, you can now establish certain event triggers and create retention or deletion policies associated to those events.
Watch the Mechanics video to learn more about how this will work and learn more about this capability here.
As organizations adopt modern ways of working, like the chat based workspace Microsoft Teams, we are excited to announce that Microsoft Teams chats and team channels are now rolling out to be included in the Data Governance features of the Security & Compliance center. Set retention policies to Teams content, similar to the way that you have the option to choose locations across Exchange, SharePoint, OneDrive and Groups today. This addition will expand your ability to meet retention and regulatory requirements with confidence across Office 365 applications.
A core component of protecting content is deleting it when it has reached the end of its useful life. As email ends its useful life, enabling the ability to manually dispose of that email enables peace of mind and smoother processing. You will be able to start to test manual email disposition features in preview starting later this month. Learn more about this update here.
Finally, we are also announcing that our new Labels Explorer dashboard is now available in preview. You will be able to harness the labels widgets and dashboard to gain insight into labels usage in your organization.
![]()
 Labels Explorer dashboard is now available in preview
 Ben Robbins, eDiscovery, Forensics & Information Governance lead from LinkedIn
As Ben Robbins says: “The Advanced Data Governance and Advanced Ediscovery features in the Microsoft 0365 Security and Compliance Center contains all the components necessary to establish and improve enterprise content controls, investigative analytics, and unstructured data management. LinkedIn has been able to take advantage of these products which help improve business process and accelerate productivity to help us in our mission to connect the world’s professionals.“
The following is provided from Microsoft Security and Compliance blogs at TechCommunity:
Event based retention is now generally available to help organizations manage retention of content based on a certain event trigger. Whether an employee departure, or the close of a project, you can now establish certain event triggers and create retention or deletion policies associated to those events.
Watch the Mechanics video to learn more about how this will work and learn more about this capability here.
As organizations adopt modern ways of working, like the chat based workspace Microsoft Teams, we are excited to announce that Microsoft Teams chats and team channels are now rolling out to be included in the Data Governance features of the Security & Compliance center. Set retention policies to Teams content, similar to the way that you have the option to choose locations across Exchange, SharePoint, OneDrive and Groups today. This addition will expand your ability to meet retention and regulatory requirements with confidence across Office 365 applications.
A core component of protecting content is deleting it when it has reached the end of its useful life. As email ends its useful life, enabling the ability to manually dispose of that email enables peace of mind and smoother processing. You will be able to start to test manual email disposition features in preview starting later this month. Learn more about this update here.
Finally, we are also announcing that our new Labels Explorer dashboard is now available in preview. You will be able to harness the labels widgets and dashboard to gain insight into labels usage in your organization.
![]()
Labels Explorer dashboard is now available in preview
Ben Robbins, eDiscovery, Forensics & Information Governance lead from LinkedIn
As Ben Robbins says: “The Advanced Data Governance and Advanced Ediscovery features in the Microsoft 0365 Security and Compliance Center contains all the components necessary to establish and improve enterprise content controls, investigative analytics, and unstructured data management. LinkedIn has been able to take advantage of these products which help improve business process and accelerate productivity to help us in our mission to connect the world’s professionals.“
The above was provided from Microsoft Security and Compliance blogs at TechCommunity


